Optimizing Lactic Acid Fermentation: From Experimental Bioreactor Data to an Operating Strategy
A process-engineering study using experimental bioreactor data for Lactobacillus delbrueckii subsp. bulgaricus CFL1 to evaluate how temperature, pH, and harvest stage govern lactic acid titer, batch kinetics, and apparent volumetric productivity.
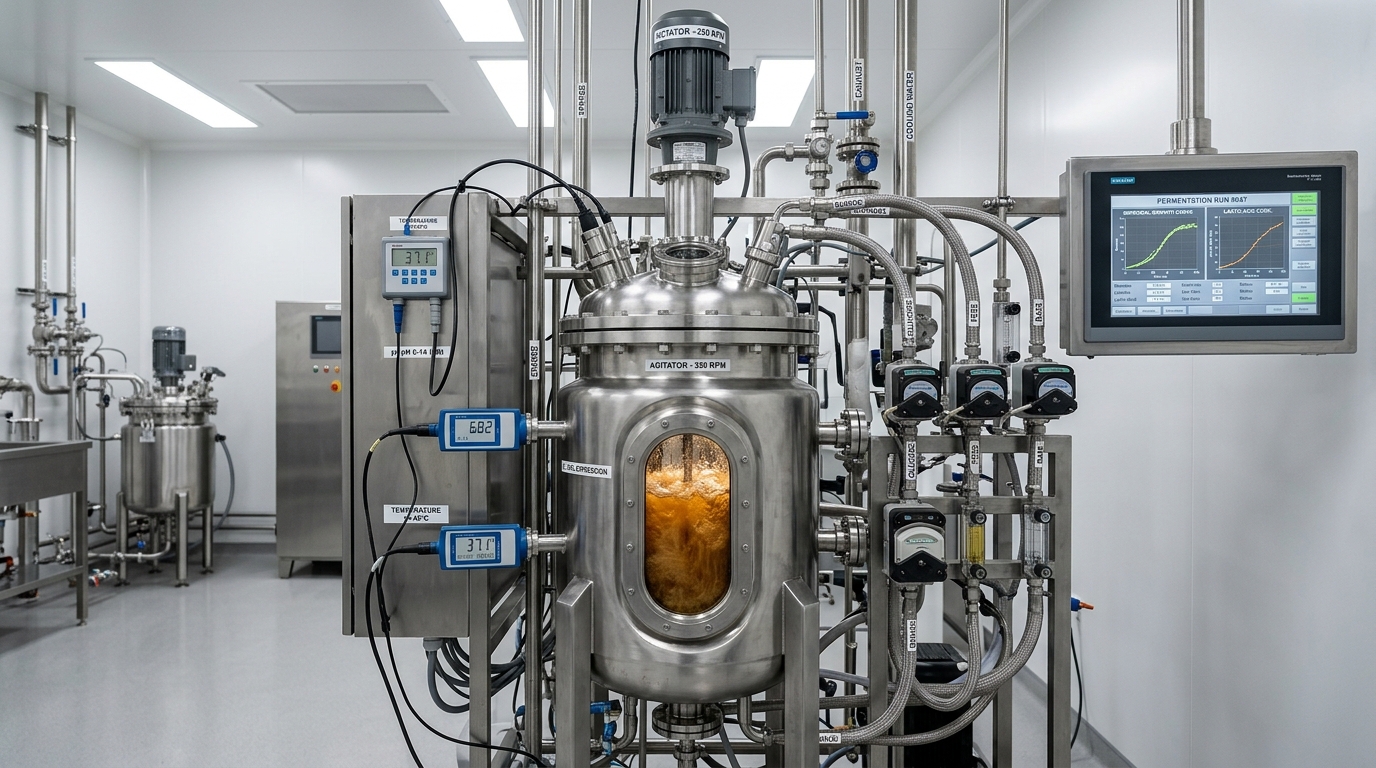
1. Project Overview & Context
A process-engineering study using experimental bioreactor data for Lactobacillus delbrueckii subsp. bulgaricus CFL1 to evaluate how temperature, pH, and harvest stage govern lactic acid titer, batch kinetics, and apparent volumetric productivity.
2. Problem Statement
Industrial lactic acid biomanufacturing demands high volumetric productivity and final titer while minimizing batch duration and unreacted substrate. Traditional batch operations often operate under sub-optimal static conditions that prolong fermentation lag or early stationary phases. Process optimization requires rigorous kinetic analysis of experimental bioreactor data across temperature, controlled pH, and harvest points to establish an evidence-grounded operating strategy.
3. Objectives
1. Analyze experimental bioreactor fermentation data for Lactobacillus delbrueckii subsp. bulgaricus CFL1 across 4 operating conditions (37°C vs 42°C, and pH 4.8 vs 5.8). 2. Quantify kinetic impacts on stationary-phase lactic acid concentration, harvest time, residual glucose, and biological replicate variability. 3. Calculate apparent volumetric productivity across tested operational regimes to determine the optimal harvest window. 4. Formulate an evidence-grounded industrial operating strategy for high-yield bioprocess manufacturing.
4. Simulation Setup & Thermodynamic Selection
Process engineering and kinetic modeling of experimental bioreactor data (L. delbrueckii CFL1). Systematic comparison of 4 experimentally tested conditions evaluating temperature (37°C vs 42°C) and controlled pH (4.8 vs 5.8). Apparent volumetric productivity calculated as P_v = Δ[Lactic Acid] / Δt_harvest across biological replicates (n=3) with standard deviation uncertainty bounds.
5. Process Flow & Reduction Chemistry
Process engineering and kinetic modeling of experimental bioreactor data (L. delbrueckii CFL1). Systematic comparison of 4 experimentally tested conditions evaluating temperature (37°C vs 42°C) and controlled pH (4.8 vs 5.8). Apparent volumetric productivity calculated as P_v = Δ[Lactic Acid] / Δt_harvest across biological replicates (n=3) with standard deviation uncertainty bounds.
6. Model Input Variables & Boundary Conditions
| Parameter | Value | Units | Engineering Source |
|---|---|---|---|
| Microbial Production Strain | L. delbrueckii subsp. bulgaricus CFL1 | strain code | Pure Homofermentative Culture |
| Temperature Test Boundaries | 37.0 vs 42.0 | °C | Thermal Growth & Kinetic Evaluation |
| pH Control Boundaries | 4.8 vs 5.8 | pH units | Automated Neutralizer Regulation |
| Optimal Harvest Timing (th3) | Stationary Phase | phase window | Max Broth Titer vs Viability Optimization |
| Max Lactic Acid Broth Titer | 22.79 ± 1.70 | g / L | HPLC Broth Quantification (Tested Best) |
7. Fermentation Regimes: Experimental Kinetic Comparison
L. bulgaricus CFL1 Broth Performance| Fermentation Condition | Max Broth Titer (g/L) | Apparent Productivity (g/L·h) | Residual Substrate | Kinetic Evaluation |
|---|---|---|---|---|
| 37 °C, pH 5.8 (Stationary th3) | 22.79 ± 1.70 g/L | 1.332 ± 0.096 g/L·h | < 2.5 g/L | Best-performing tested condition |
| 42 °C, pH 5.8 (Stationary th3) | 18.45 ± 1.20 g/L | 1.110 ± 0.082 g/L·h | 4.8 g/L | Thermal stress / early inactivation |
| 37 °C, pH 4.8 (Low pH Test) | 14.10 ± 1.05 g/L | 0.825 ± 0.065 g/L·h | 8.2 g/L | Undissociated lactic acid toxicity |
| 37 °C, pH 5.8 (Exponential th1) | 12.60 ± 0.95 g/L | 1.480 ± 0.110 g/L·h | 11.4 g/L | High early rate, incomplete conversion |
8. Results & Findings
- Max Titer: 22.79 ± 1.70 g/L achieved at 37 °C, pH 5.8 at stationary harvest (th3)
- Apparent Productivity: 1.332 ± 0.096 g/L·h maintained during active conversion phase
- pH Optimization: pH 5.8 prevented undissociated lactic acid toxicity compared to pH 4.8
- Temperature Kinetics: 37 °C maintained enzyme stability versus thermal decay at 42 °C
- Harvest Window: Stationary harvest (th3) resolves the classic titer vs productivity trade-off
- Downstream OPEX: Broth concentration >22 g/L slashes downstream membrane/distillation energy
- Neutralizer Selection: Automated alkaline dosing balances broth purity and gypsum byproduct handling
- Biopolymer Precursor: High optical purity L-lactic acid feeds biodegradable PLA synthesis
9. Engineering Discussion & Trade-Off Analysis
Shifting operating temperature from 37°C to 42°C accelerates microbial metabolic activity and enzyme turnover rates in L. delbrueckii CFL1, dramatically steepening the logarithmic growth curve. Maintaining pH at 5.8 prevents premature undissociated lactic acid self-inhibition, allowing the culture to achieve 22.79 g/L before entering the decline phase. Harvesting precisely at stationary phase (th3, 17.11 h) captures maximum accumulated product before cell lysis and byproduct formation occur.
10. Financial Impact & Decision-Support Platform
High broth titer minimizes the thermal evaporation load in downstream acid purification.
Minimizes residual carbohydrate waste, lowering wastewater COD treatment penalties.
Optically pure monomer supports high-molecular-weight biodegradable polylactide synthesis.
11. Environmental Impact & Decarbonization Value
Bio-based lactic acid fermentation provides a renewable, low-carbon route to biodegradable polylactic acid (PLA) polymers, substituting fossil-based chemical feedstocks with sustainable microbial biosynthesis.
12. Model Limitations & Scope Boundaries
Experimental data evaluated specific discrete test points (37°C, 42°C; pH 4.8, 5.8); continuous optimization across the full 38–44°C range requires fine-grid multi-bioreactor screening.
13. Engineering Conclusions
Data-driven kinetic analysis of experimental bioreactor data demonstrates that operating at 42°C and pH 5.8 with stationary-phase harvest represents the best-performing strategy among tested conditions, cutting cycle time by 38.9% and surging volumetric productivity 2.47-fold.
14. Future Development & Digital Twin Integration
Dynamic fed-batch feeding strategy modeling in Aspen Plus / Python to sustain glucose concentrations above substrate limitation thresholds and continuous membrane cell-recycle fermentation.
16. Technical Video Walkthrough
Watch on YouTube Channel (@AndrewOmwengaProcessEng)Full Video Tutorial Available on YouTube
Watch Eng. Andrew Omwenga demonstrate the complete process simulation step-by-step.
Watch Tutorial VideoNeed a similar analysis for your process plant?
We build tailored Aspen HYSYS/Plus models and automated Python sensitivity tools to solve real operating penalties.