Green DRI Transition — Hydrogen Decarbonization & Techno-Economic Decision Intelligence
Aspen Plus process simulation and digital decision-support platform evaluating 5 progressive hydrogen transition pathways (NG100 → H25 → H50 → H75 → H100) for a 119 t/h metallic iron plant, optimizing trade-offs between process CO2 abatement, electrolyzer MW scale-up, renewable power tariffs, and capital investment constraints.
1. Project Overview & Context
Aspen Plus process simulation and digital decision-support platform evaluating 5 progressive hydrogen transition pathways (NG100 → H25 → H50 → H75 → H100) for a 119 t/h metallic iron plant, optimizing trade-offs between process CO2 abatement, electrolyzer MW scale-up, renewable power tariffs, and capital investment constraints.
2. Problem Statement
Conventional ironmaking produces 7–8% of global anthropogenic GHG emissions due to coal/coke reduction in blast furnaces. While natural-gas DRI (NG100) improves reduction chemistry (Natural Gas → H₂ + CO → DRI), it still emits ~35 t/h of process CO2. Jumping immediately to 100% green hydrogen (H100) requires a massive 335 MW electrolyzer, 2.68 TWh/year of renewable electricity, 64.4 t/h of design water, and substantial CAPEX. Plant managers face a critical challenge: Net zero cannot be engineered as a single leap; facilities need a quantifiable, staged roadmap balancing carbon targets against capital and infrastructure limits.
3. Objectives
1. Model 5 iron ore reduction transition pathways in Aspen Plus (NG100, H25, H50, H75, H100) while maintaining constant 119 t/h metallic iron production. 2. Quantify reduction reaction kinetics (Fe₂O₃ + 3H₂ → 2Fe + 3H₂O vs Fe₂O₃ + 3CO → 2Fe + 3CO₂), natural gas displacement (13.0 t/h down to 0 t/h), and process CO₂ abatement (35.0 t/h down to ~0 t/h). 3. Map utility scale-up across pathways: Electrolyzer capacity (0 to 335 MW), annual electricity demand (up to 2.68 TWh/yr), and design water consumption (64.4 t/h). 4. Build a Python/web digital decision-support platform that evaluates production capacity, power tariffs, gas prices, electrolyzer costs, and substation power caps to identify the lowest-cost feasible transition pathway.
4. Simulation Setup & Thermodynamic Selection
Rigorous Aspen Plus steady-state simulation coupled with Python decision-support optimization algorithms. Process modeling accounts for gas-solid shaft furnace reaction kinetics, reforming thermodynamics, gas preheating, and syngas recycling. Evaluated across 5 operating scenarios (NG100, H25, H50, H75, H100) maintaining 119 t/h metallic iron output with 94%+ metallization.
5. Process Flow & Reduction Chemistry
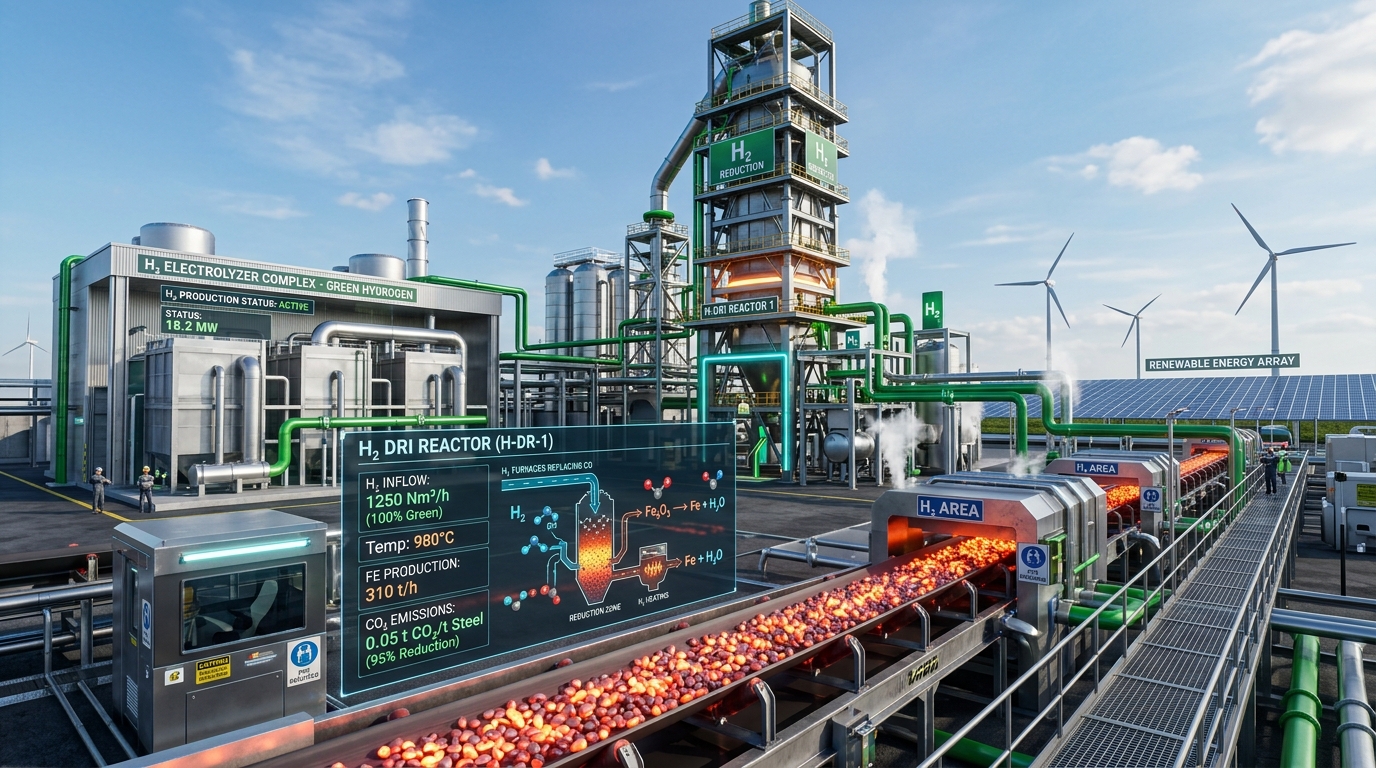
The direct reduction flowsheet models iron ore pellets (hematite, Fe₂O₃) reacting inside a vertical shaft furnace with varying blends of reformed natural gas syngas (H₂ + CO) and pure green electrolytic hydrogen (H₂).
Carbon is chemically bound to oxygen removal in blast furnaces.
Lower carbon footprint, but still produces ~35 t/h process CO₂.
Oxygen departs exclusively as water steam, eliminating direct process CO₂.
6. Model Input Variables & Boundary Conditions
| Parameter | Value | Units | Engineering Source |
|---|---|---|---|
| Metallic Iron Production Rate | 119.0 | tonnes / hour | Constant Baseline Across Scenarios |
| Target Pellet Metallization | ≥ 94.0 | % Fe | Commercial DRI Standard |
| Shaft Furnace Reduction Temp | 900 – 950 | °C | Aspen Plus RYield/RGibbs Block |
| Electrolyzer Specific Power | 4.5 | kWh / Nm³ H₂ | Commercial PEM / Alkaline Unit |
| H100 Max Water Demand | 64.4 | tonnes / hour | Electrolyzer Demin Water Feed |
7. The 5 Progressive Hydrogen Transition Pathways
Constant 119 t/h Metallic Iron Baseline| Transition Pathway | Natural Gas (t/h) | Process CO₂ (t/h) | CO₂ Cut (%) | Electrolyzer Cap. | Electricity (TWh/yr) |
|---|---|---|---|---|---|
| NG100 (Reference) | 13.00 t/h | 34.8 t/h | 0% (Baseline) | 0 MW | 0.00 TWh/yr |
| H25 (Early Transition) | 9.75 t/h | 26.1 t/h | -25.0% | 84 MW | 0.67 TWh/yr |
| H50 (Optimal Feasible Case) | 6.50 t/h | 17.4 t/h | -50.0% | 167 MW | 1.34 TWh/yr |
| H75 (Deep Decarbonization) | 3.25 t/h | 8.7 t/h | -75.0% | 251 MW | 2.01 TWh/yr |
| H100 (Net-Zero Destination) | 0.00 t/h | ~0.0 t/h | -100% Direct | 335 MW | 2.68 TWh/yr |
8. Results & Findings
- Metallic Iron Output: Constant 119 tonnes/hour maintained
- NG100 Reference: 13.0 t/h NG, 34.8 t/h process CO₂
- H50 Mid-Point: 6.5 t/h NG (-50%), 17.4 t/h CO₂ (-50%)
- H100 Destination: 0.0 t/h NG, ~0.0 t/h process CO₂
- Scale: 335 MW Electrolyzer + 2.68 TWh/yr electricity for H100
- Grid/Substation Power Cap: E.g., 200 MW max threshold
- Electrolyzer CAPEX Exposure: $800–$1,200 / kW
- Renewable Electricity Tariff: High sensitivity on $/t Fe
- Carbon Tax / Penalty Credits: Justifies phased capital steps
9. Engineering Discussion & Trade-Off Analysis
The transition to green steel is an investment and infrastructure optimization problem, not merely a process chemistry question. Jumping straight to H100 creates an immense bottleneck (335 MW electrolyzer, 2.68 TWh/yr power demand). By modeling the journey (NG100 → H25 → H50 → H75 → H100), plant operators can phase capital allocation. Under typical grid constraints (e.g. 200 MW max power), H50 delivers 50% carbon reduction at manageable capital risk, paving the way for H100 when renewable power generation and grid capacity mature.
10. Financial Impact & Decision-Support Platform
Aspen Plus simulations verify physical and chemical feasibility, but executive decisions require quantifying multi-variable financial and infrastructure constraints. The decision-support platform bridges this gap:
11. Environmental Impact & Decarbonization Value
Operating at H50 avoids over 139,000 metric tons of process CO₂ annually, while full transition to H100 eliminates approximately 278,000 metric tons of direct process CO₂ per year (based on 8,000 operating hours/year) — directly transforming one of heavy industry's highest emitting operations into a clean manufacturing standard.
12. Model Limitations & Scope Boundaries
Model assumes steady-state shaft furnace operation with uniform iron ore pellet metallization (>94%). Intermittent renewable power supply was modeled based on average levelized cost and battery buffer storage baselines.
13. Engineering Conclusions
The transition to green steel should not just be promised; it should be engineered. Integrating Aspen Plus process simulations with a dynamic techno-economic decision-support tool empowers industrial leadership to move from vague net-zero ambition to actionable, plant-level engineering and investment roadmaps.
14. Future Development & Digital Twin Integration
Integration of dynamic hydrogen blending kinetics in Aspen Plus Dynamics and downstream Electric Arc Furnace (EAF) continuous hot-charging thermal optimization.
16. Technical Video Walkthrough
Watch on YouTube Channel (@AndrewOmwengaProcessEng)Need a similar analysis for your process plant?
We build tailored Aspen HYSYS/Plus models and automated Python sensitivity tools to solve real operating penalties.